
Visual Micro is very an interesting extension for Microsoft Visual Studio (it works also in Atmel Studio). It allows you to program Arduino directly from Visual Studio environment – that’s cool, but that’s not all!
Visual Studio is incomparable with Arduino IDE in terms of users experience. It gives you all kinds of goodies like IntelliSense, syntax highliting, code navigation, git/svn/whatever integration and so on. But wait for it… it gives you also a debugger!

Debugging AVR processor requires dedicated external HW debugger, which is pretty expensive gadget. So Visual Micro is not true debugger but still, fairly awesome.
How it works?
Visual Micro utilize technique called Instrumentation.
We can take this code as an example:
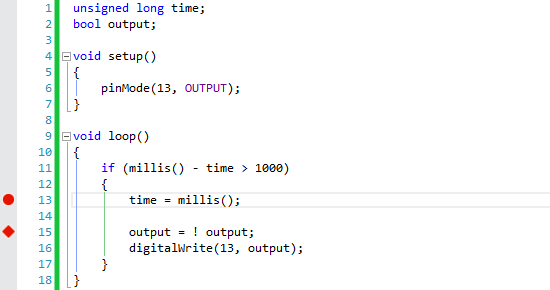
When you start debugging in VS, Visual Micro takes your code and inserts small pieces of its own code into it. First is at the beginig of setup() and next to everywhere where breakpoints are.
Result is saved to temporary folder, so anybody can look at it. Path to it is usually something like c:\Users\{UserName}\AppData\Local\VMicro\Arduino\Builds\
Result of this process for the example shown above looks like this:
If you open it in normal Arduino IDE, Serial Monitor gives you something like this:
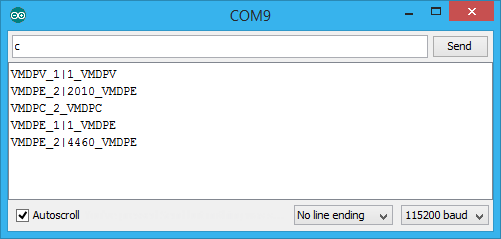
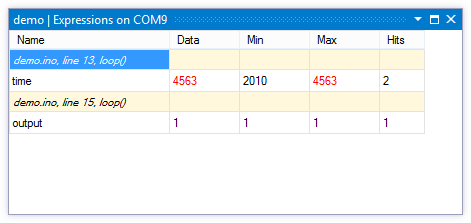
The magic happens when Visual Micro takes this cryptical lines and visualize it nicely in Visual Studio.
And that’s what you are paying for. Visual Micro with Debugger is not for free. The instrumentation is fairly simple, but the integration into Visual Studio is more difficult part. Price starts at $29. But it’s worth it.